Marketing exploration and mining globally

NEWS FLASH- book and course Custodians and Earth Custodians (Vision For Caring For Our Earth’s Ecosystem) are available . SEE- Main Menu: Custodians 
PDAC review of exploration in 2017, projections for 2018 and marketing to promote investment
S&P Global Market Intelligence predicts that exploration will continue to expand over 2018 (PDAC S&P market intelligence) . Sustaining exploration and mining
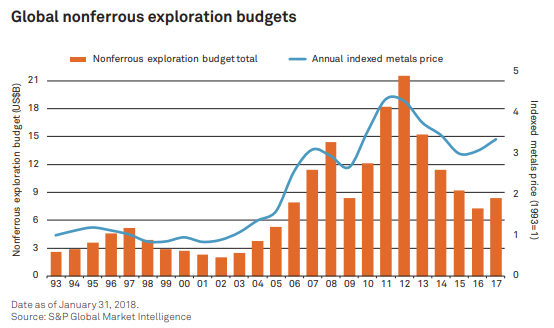
Exploration expenditure globally in 2017 for nonferrous metals increased US$8.4 billion mo re than US$1 billion in excess of 2016. This was the first annual increase after four consecutive years of declining investment, according to the World Exploration Trends (WET) report from S&P Global Market Intelligence, released in conjunction with this year’s Prospectors & Developers Association of Canada (PDAC) International Convention in March 2018.
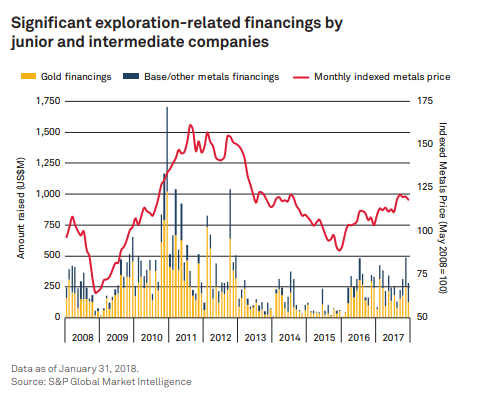
Mark Ferguson from S&P Global Market Intelligence commented that an improved equity market support for explorers facilitated drill programs by companies on more promising projects. Gold was a main focus for no-ferrous metals and base metals exploration improved in the second half of the year, and with the renewable sector and EV demand battery metal projects contributed to the increase.
Q4 of 2017 demonstrated an increase in reported drill results, and project financing t improved resulting in a level of exploration activity similar to early 2013. Despite market volatility in metal prices achieved were positive. However, sustaining the increase in exploration will be a challenge for 2018 and require better promotion of projects and stable geopoltical situation.
Key takeaways from the report:
- Signs of life: following four years of depressed spending in exploration , aggregate nonferrous exploration budget increased to US$7.95 billion of PDAC surveyed companies — a 14% increase over 2016.
- Due to funding challenges faced by some junior companies early in the year, explorers’spending plans declined to 1,535 companies (- 3%) year-over-year .
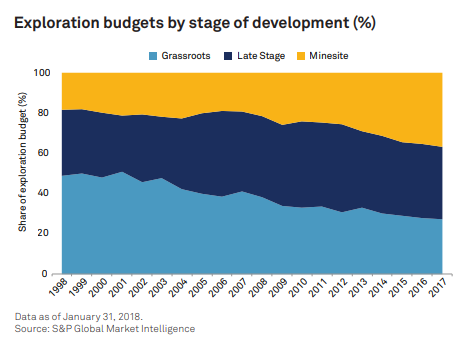 major miners (revenues >US$1 billion) allocated only a small proportion of revenues to exploration with riskier exploration remaining relatively unattractive.
- Canada, Australia and U.S. : with allocations totalling US$5.55 billion lead the exploration spending. The top 10 countries accounted for 70% of the US$7.95 billion global surveyed total.
- Gold led the way to a higher global budget in 2017.
- Battery metals exploration surges: lithium exploration allocations in 2017 more than doubled year-over-year, while cobalt-focused exploration also increased strongly.
- Exploration improves: The S&P Global Market ket pricess Intelligence’s measure of exploration activity, ( Pipeline Activity Index) increased from 77 (Q3) to 87 in Q4 the highest since Q1 2013, at the start of 2018.
ASX monthly market trends
Share prices for ASX listed companies over the six month period to October 2018 show a trend that very few resource based stocks have changed positively over the period in value over the period are related to energy production, but this a changeable issue related to market demand and perceptions of company performance in this very competitive marketplace.
For current information I recommend Rob Murdoch of AUSTEX who publishes a subscription based review of the mining industry trends in Australia looking at 794 Australian companies and gives an ongoing view of the marketplace in real time.