Mapping resources

NEWS FLASH- book and course Custodians and Earth Custodians (Vision For Caring For Our Earth’s Ecosystem) are available . SEE- Main Menu: Custodians
Four major benefits To Choose Cranfield Geoservices For Geological mapping, Basin Analysis and Mineral and Energy Resources Projects–
- Experience and leadership in geological mapping in Queensland and Papua New Guinea over 45 years
- Bespoke integration of relevant aspatial (databases of analytical and observational data and drill holes) and spatial (geophysics, remote sensing, geological mapping) geoscientific digital data to target specific resources.
- Delivery of expert geological mapping consulting services, staff training and infrastructure advice to improve your geological mapping and exploration targeting
- Very broad experience in multiple geological services and terrains as demostrated on the LinkedIn profile.
CONTACT FOR AN APPRAISAL OF YOUR GEOLOGICAL MAPPING NEEDS–+61 498259376
The value Geological Mapping is underestimated in many work programs
- Geological mapping is a fundamental primary tool of the field geologist. The precise relationships between rock units and mineral and energy resources in a region is fundamental to understanding of a region at all scales. Discovering and documenting the age, stratigraphical, sedimentological and structural relationships of the rock units in a region is vital to understanding its economic potential. This combined with the timing of intrusive events and the mode of formation of mineral and energy resources forms the basis of all exploration. At a regional scale, geological mapping and regional potential is identified initially by Government geological surveys and at a local (prospect) scale exploration companies carry out detailed investigations to identify economic mineral and energy deposits . Depending on the commodity and the style of the deposit these investigations may include some or all of the following includes grid-based drilling combined with geochemical testing of drill and surface samples, multiple geophysical and other remote sensing surveys (including hyperspectral data over landscapes and drill core) . Logical integration of all these sets is critical to develop cost-effective targeted exploration. From extensive experience in geological terrains in Queensland, Papua New Guinea, China, Hong Kong and Mongolia our company can offer your company high quality field mapping, and target generation of your mineral and energy projects.
CGSI can deliver QA/QC reviews of :
- Field mapping of minerals and energy resource areas with focused geological reinterpretation of airborne, ground-based and down-hole geophysics
- Effective exploration targeting services for energy and mineral resource
- Effective and efficient use of portable XRF for rapid assessment of samples for follow up diamond drilling
- the effectiveness of drilling programs and advising on modifications to current program
- Effective integration of use of remote sensing techniques for targeting of mineral and energy resource anomalies
- Effective use of geophysical techniques on your tenement with advice on specific studies of rock properties
A list of more than 100 publications is included in article summarizing my career as a geologist. These reflect a range of expertise in coal, mineral and energy resources, Geological Mapping, Basin Analysis, report editing and project.
- High level local knowledge of the stratigraphy, sedimentology and structure of southern Queensland basins,
- Specific, sequential Geological Basin Analysis framework and enhanced staff training through an integrated interpretative methodology of multiple data sets. These include target generation in different basins and the solution of previously unexplained apparent geological data anomalies.
- Deliver y of a comprehensive understanding of the use of geological structure, stratigraphy, remotely sensed and geophysical data in identifying and targeting regions of potentially economic resource using geological mapping and mineral and energy potential studies over southern and northern Queensland, Papua New Guinea Highlands and Hong Kong.
A Local example of recording and updating the stratigraphy of the eastern Surat Basin.
A report interpreting and integrating regional airborne radiometric and magnetic geophysical imagery over the Surat Basin with boreholes and other data demonstrates that coal seam gas producing units (Springbok Sandstone and Walloon Coal Measures) can be defined in outcrop at the northern basin margin. This package of coal seam gas producing units could be distinguished from the underlying Mesozoic Eurombah Formation and overlying Westbourne Formation. The geochemical signatures of the different geological units were used to update the stratigraphy of the Surat basin in the area of outcrop.
In the subsurface, extension of the boundaries of the sub-cropping coal seam gas producing units beneath Cainozoic cover rocks was generated through interpreting and integrating regional airborne magnetic and radiometric imagery, coal seam gas drilling, stratigraphic drilling, water bore data, previous geological mapping and local knowledge from coal seam mining in the Walloon Coal Measures. To gain a comprehensive understanding of the extent of the entire sub crop extent of these units it was also necessary to understand the deposition sequence of the overlying Cainozoic Condamine Basin. This was by interpreting logs of water bore data and integrating these with regional radiometric and satellite imagery and also using hylogger multispectral analysis of surface and core samples combined with hand-held portable XRF results.
- FOR YOUR BASIN ANALYSIS PROJECTS -RING ME ON+61498259376
Basin analysis Expert
Local Example : Queensland Structural Elements (Including Basins)
Queensland has a series of structural elements with ages ranging from Proterozic to Holocene
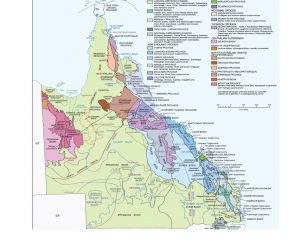
The main outcropping mineralised province (containing base and precious metals) is the Proterozoic age Mount Isa inlier in the northwest of the State. Coloured area in blues, browns along the eastern seaboard of Queensland are part of the Tasman Orogenic Zone that ranges in age from Ordovician to Permian. These areas produce mainly precious metals and copper.
Basin areas that overlie these older rocks range in age from Permian to Cretaceous (green areas) in south-eastern Queensland and covering the central area of the state through to the top of Cape York. These basin areas produce most of the states’ oil and conventional gas, coal and unconventional coal seam gas. Basin areas include the major coal resources of the Bowen basin and a proposed new project in the Galilee Basin at the Adani Carmichael Mine Site.
A Industry priority project involving integrating company borehole data and revising basin stratigraphy over the eastern Surat basin ‘s unconventional gas resource units completed by the p:-incipal is outlined below:-
Surat basin project data integration (2015-2017)

The image of the Surat Basin in south-eastern Queensland above shows radiometric (K,Th,U channels in red, green, blue) combined in a multicoloured image using colour additive theory. The image demonstrates the utility of regional airborne radiometric imagery to showing variations in rock chemistry between geological basin units. These variations in rock chemistry and distribution of different units is uniquely linked to their genetic stratigraphic sequence, tectonic evolution and post-depositional weathering processes.
Techniques used in this project involved the integration of multiple data sets –
- Digital Geological seamless maps compiled using Arc GIS software,
- Remote sensing of the terrain linked to digital contours contrasting outcropping rock units and fluvial architecture
- national seamless digital geological survey maps,
- interpretation of airborne geophysics using radiometric for surface features and aeromagnetic data for surface and subsurface units,
- Validation of surface and subsurface boundaries using borehole and coal mine data
- Google Earth data linking geological boundaries to borehole data using Kml and Kmz files
Some predicted geological boundaries are shown on the image as thicker black, blue and white lines, however, the variations in the chemistry from airborne radiometric data predicted new boundaries that were confirmed through field work over two separate periods. Most basins in the central part of Queensland were mapped in the 1960s prior to the availability of remotely sensed satellite and regional airborne geophysics that has covered most of the Australian continent. The variations in chemistry and topography that can be demonstrated by these techniques combined with regional landscape studies assist markedly in updating geological maps of these basins in areas where surficial outcrop is poor. The use of regional magnetic data over the project area also identified areas of probable basaltic sills in the overlying Mesozoic rocks of the Surat basin as well as likely zoned igneous bodies at a shallow depth at the eastern edge of the basin.
The cross validation and integration of different geoscience data sets allows for the creation of multiple views of the geology from an Arc GIS created map product using Natural Resources and Mines, Queensland’s customised version of the software. Identification of mapping line data as surficial, buried below one or multiple layers allows for a range of 3-dimensional views of the same data.
CONTACT US FOR A FREE APPRAISAL FOR YOUR BASIN ANALYSIS PROJECTS
Mapping and resource product- Surat Basin coal seam gas units and methodology to establish a new stratigraphic framework
Data integration undertaken by CCGSI was an coal seam gas industry priority project in the eastern Surat Basin. Digital data is now available for viewing in MinesOnline Maps. The attached document provides instructions for how you can view the data in Mines Online Maps from Queensland government,s DNRM website:
Digital data
You can download a copy of the digital data from the site QSpatial: on the Queensland Government website.
The data is available as a separate package called: “Coal Seam Gas Units 2017 – Northern Surat and Clarence Moreton Basins”. Alternatively you can download the Detailed Structure, Surface and Solid geology if you want the latest geology for the state. (The new interpretation is included in the state-wide coverage).
Links for each of these packages are provided below:
Surat only digital package: View the digital package here
Detailed Structure: The detailed structural interpretation from surface and subsurface data is given here
Detailed Surface geology: A detailed digital Surface geology interpretation is shown by linking to the data.
Detailed Solid geology: The interpretation of both the underlying subsurface extent and the surface outcrop of the Walloon Coal Measures and the Springbok Sandstone is depicted in the Solid Geology digital coverage.
Report and hard copy maps
Cranfield, L.C., 2017: Mapping of Surat Basin coal seam reservoir units. Queensland Minerals and Energy Review. Department of Natural Resources and Mines.Click here for report and hard copy map details
CONTACT US FOR AN APPRAISAL OF YOUR GEOLOGICAL MAPPING NEEDS