NEWS FLASH- book and course Custodians and Earth Custodians (Vision For Caring For Our Earth’s Ecosystem) are available . SEE- Main Menu: Custodians
My career and capabilities are well explained in about us

End of School and Advice to Pursue a Career in Geology
My first knowledge that geology existed as a career was following the completion of high school when I had just completed all the required exams to gain access to university but had no idea what studies to pursue. I went to see my mother’s cousin who headed up a coaching college in Brisbane. He had a BSc in science from the University of Queensland, so I considered him a good mentor. At the time I was very enthusiastic to find out my direction in studying something in the science field, but had no specific idea what that would be. He suggested studying geology and outlined a 50/50 split between office work and work in the fresh air. I was gobsmacked – I was unaware that a choice like that existed in science so I enrolled with the purpose of seeing parts of the world that few people ever see and looking forward to the adventure.
Starting out in the Geological Survey of Queensland
My first employment in 1969 was in the coal section at the Geological Survey of Queensland (GSQ), Redbank and encompassed coal resources projects in the Ipswich Coalfield. The Ipswich coalfield was beginning to wind down as exploration and pressures of urban expansion had already affected development of deeper resources in this field as development of the Bowen Basin coals began to ramp up. I was appreciative of the well researched standards that established by the GSQ and the mentoring and advice given to new staff at GSQ. This was a feature of all my career in GSQ. Initial work included drilling and logging coal and strata near Swanbank Power Station, within Ipswich city and in Redbank Plains with geological mapping in the area. Part of my work included underground logging of the Bluff seam at Box Flat Extended Mine area where there was an explosion with several deaths a couple of years later. I became aware that although I enjoyed core logging I was mainly confined to an office at Redbank with local work in the Ipswich region.
Change to Geological Mapping and finding a niche
Work in the coal section lasted until late 1970 when, based on my enjoyment of geological mapping from work at Redbank, I applied to join the Regional Mapping Branch in the city so that I could spend significant amounts of time away from the office enjoying the experience of creating new geological maps. The initial mapping project was the Ipswich and Brisbane 1:250 000 sheet areas. This style of mapping was very different from the detailed mapping undertaken at university and required a different approach. This was the time of generation of new knowledge including the understanding and acceptance of plate tectonics and earth processes. Due to its geographic location close to the capital city many student and published maps and reports needed to be assessed in context with the new paradigm. This assessment and later work showed a major fundamental flaw in the existing mapping in that map boundaries from adjacent areas didn’t generally join at the boundaries, because different geologists didn’t classify geological units in the same way. Consequently there were ‘splitters’ (geologists who recognised different units and sub units) and ‘lumpers’ (who made broader subdivisions where there may be several units) in the game of geological mapping
The process of regional geological mapping commenced in the early 1950s through the Bureau of Mineral Resources (BMR) now Geoscience Australia (GA). Much of the land area of Australia was mapped prior to the early satellite imagery however, the access to this imagery assisted the first mapping project and later projects in identifying major regional scale geological linear features. The quality of the early images was poor and was only available as black and white photographs
Further Studies in Geology and Geography
In 1970 I undertook study to complete a MSc qualifying at University of Queensland while working full time at GSQ. My intention at that time was to complete a MSc and continue on to a PhD. However my plans were modified by family commitments and from 1973 to 1977 I studied geography subjects available at the University of Queensland and french and German Language. Knowledge is never wasted and study of physical geography and geography of natural land forms and human interaction and demographics formed part of my work in my chosen career.
During the 1970s and early 1980s work at GSQ involved local field mapping at both 1:250 000 at 1:100 000 scales, extensive stratigraphic drilling and analysis of basins of southeast Queensland and field trips and discussions about economic and industrial minerals in southeast Queensland. At this time digital processing technology was evolving and I was trained in the first image processing technology used by the Queensland government.
Digital Image processing and creation of digital maps
As digital image processing technology evolved to assist geological mapping the link between digital site information from the work of the Canadian Geological Survey led to creating GSQ databases, to my interest in this technology and with other GSQ geologists databases based on point data – Surface geology and Mineral occurrence databses were formed at GSQ. These databases were leaders in government geoscience in Australia with GA following up with their own system. During this time the digital topographic information and imagery was under the control of AUSLIG based in Canberra. At this time there were a range of restrictions and huge expense of acquiring and using this imagery. Frustrations with the cost and access to this data resulted in a proposal to Geoscience Australia about the restrictions, use and cost of this data. Other states also had the same concerns and put in similar submissions. This led to GA’s incorporation of AUSLIG and the ongoing cost-effective and efficient use of digital data in geological maps and GIS products.
I became absolutely convinced that GSQ need image processing technology and implementation coincided with digital image processing of geophysical data so that this technology was implemented in GSQ. Linking databases to imagery in geographic information systems (GIS) technology allowed GSQ to create geology maps and update them from that time and integrate geological map data, imagery and resources to model the spatial location and geological processes that control mineral and energy resources. The interest in GIS, databases and processing airborne geophysics led me to complete a MSc in remote sensing, geology and mineral occurrence to understand spatial relationships of gold mineralisation in the Charters Towers which incidentally published when I work at the University of Hong Kong.
The use of image processing and creation of databases it still became more obvious that mapping edge joins were an issue and a new approach was necessary to both resolve map boundary joins and the differences in interpretation . From this I evolved the idea of digital seamless geological GIS projects.
In the early 1990s I worked in processing airborne geophysics and satellite imagery for the province mapping carried out along the eastern coastal and near coastal areas. This increased my knowledge of airborne geophysics and the integration with satellite imagery, maps and databases.
Restructuring, Geoscience GIS and GSQ management roles
A restructure of GSQ and a downturn in the mining industry in the mid-late 1990s provided the impetus for a new approach to creating seamless maps and reports of large areas. At that time, as geoscience manager Southeast Queensland Project and with GSQ and unemployed industry geologists on contract I evolved a methodology to enter information from old note books and mineral occurrences into databases, linked these to existing geology and discovered ways to interactively validate and improve and link the existing geology. This resulted in GSQ’s first geoscience GIS product – the Southeast Queensland GIS and the change by GSQ to province mapping projects in Queensland and creating maps from the project – Faster, better and more efficiently. Following work on the Yarraman project that occurred in the late 1990s to 2000 new geological maps and a more efficient reporting style was implemented and improvements in the mapping were included in an extended update of the southeast Queensland GIS. The role of Geoscience Manager Southern region in DNRM had different and unexpected links to land use management
Tenement Management management in Government
In 2002 I had a change of roles to be the project leader leading management of assessment of exploration tenure for the department and reporting directly to the minister that arose on major projected mining projects. The This experience assisted me in may later role in Mineral Resources Authority Papua New Guinea.
Experiences in China and Hong Kong
The 2000s were a really interesting time in my career and life. I went to Hangzhou China and voluntarily taught English conversation for two months and in 2003 I took long service leave and went to the University of Hong Kong where I created a course in field techniques, report writing methods, air photo interpretation, remote sensing and the use of GIS technology in geoscientific projects. This time was very satisfying as I could impart my knowledge of being a practicing geologist and see the development of the next generation of geologists in a different environment where the only local employment available was in government geotechnical work. This was an interesting time as it coincided with the SARS outbreak in southern China and for a time the university was closed and I lectured to a room of students who were all wearing surgical masks.
I returned to Brisbane in late 2003. While absent in Hong Kong, another restructure of GSQ recreated functional groups to put the best staff in their preferred roles. Upon returning to GSQ from Hong Kong I was appointed Geoscience Manager, Mineral Resource Studies. This role provided another and different challenge for me as I needed to upgrade my skills to managing a different group of geologists who had been carrying out this role since 1987.
MINOCC, The Pmd*CRC and National Geochemistry Survey
The period from 2003 to 2009 was very satisfying as the Mineral Resource Studies group which completed the first pass of the mineral resources of the state. The method included locating as many as possible of historical working and current operations as possible from the remaining areas not already covered in previous field campaigns. This this was done on a Province basis similar to that for geological mapping. In this process some areas were updated with better located GPS technology and all areas were updated from annual reporting over mining areas. In this period, GSQ became a partner in the predictive mineral discoveries cooperative research (Pmd*CRC). This project looked at mineral deposits somewhat analogously to energy resources using the creation of mineralising fluids, identifying and predicting fluid flows to the site of deposition and the identification of mineralised regions that that were much larger than the know mineral deposits. A better understanding of the age and chemistry of potential fluids, direction of fluid flows, dilatant zones and host rock chemistry and the timing of mineralisation was required to better understand mineralised systems. To this end a geochemist role was created in the group, a project to acquire age dating of source rocks from university theses was required and funded by GSQ. An interesting project completed by Mineral Resource Studies at that time was the Queensland contribution to the National Geochemical Survey of Australia. This study incorporated a regional geochemical study of drainage basins of Australia for basins. Information gained from this study identified significant areas in Cape York that have been followed up in later surveys. Due to staff numbers I undertook fieldwork in Cape York in 2008, collected samples and went to the most northerly point of the Australian mainland north of Bamaga Here I looked out towards Papua New Guinea and wondered what it would be like to visit there. Much to my surprise it was sooner than I thought.
Papua New Guinea (PNG) A New Adventure 2009-2012
In early 2009 when acting as Director, GSQ due to an overseas trip by the Director I was contacted by the current Executive Manager, Geological Survey Division, Mineral Resources Authority, Papua New Guinea who made a request for GSQ to review mapping by an European Union (EU) funded GEOMAP project in the western highlands of PNG. He told me that he was leaving MRA to return to the university. The next week there was an advertisement for Executive Manager, Geological Survey Division in Port Moresby and, with Mineral Resources Studies having completed the first pass mineral resources of Queensland, I thought it was time for a new challenge. From 2009-2012 the role of Executive manager was very satisfying as due to the state of the industry and funding there were opportunities to upgrade staff skills through their completion of Masters degrees at Australian and European Universities. This period also was characterised by the creation of a geothermal energy group in conjunction with Geological and Nuclear Sciences (GNS) in New Zealand and MOUs with the GNS to carry out collaborative geothermal chemical studies and China Geological Survey to train staff to collect samples for a national geochemical survey. In addition, the geological mapping from the funded GEOMAP was reviewed and joined to mapping by GA over PNG. As a member of the Mining Advisory council in PNG I reviewed the program for all applications for granting and renewal of tenure in PNG from 2009-2012.
Family issues caused my return to Western Australia in late 2012, however before departing PNG I realised that there was a need to train staff in another area of MRA to better assess company reporting. Consequently, I wrote a proposal for contract work before departing PNG.
In 2013, I spent several periods in PNG training staff in identifying issues with company reporting and developed a guide for this process. Other work carried out was developing a methodology to assess the validity of statistical information from the mining industry for the Sovereign Wealth Fund, assessed several applications for new mining leases and updates of existing mining lease and recommended a new tenure management system from Spatial Dimensions (now Trimble) from South Africa.
Major Bust In The Mining Industry -2013-2014
The collapse of the mining industry in 2014 was an issue for geologists globally and I thought at the time I was going to retire, however due to family issues again I returned to Queensland and was relaxing on the Sunshine Coast not thinking about working when I received two offers in successive days.
Surat Basin and Mongolia consultancies 2015-2017
Consultancies include Surat Basin mapping of the outcrop and subcrop of the coal seam gas units in the Surat basin and as a international expert in Mongolia to recreate a national geological survey (NGS). I undertook the Surat Basin Project and work on this project from September 2015, and it was published in July 2017. This project showed the values of airborne geophysics for upgrading surface and subsurface mapping and the linking of databases of borehole intersections and magnetics to subsurface mapping. Two months in Mongolia and completed recommendations for the role of a National Geological Survey.
Current interests and direction 2018-2019
My goals are to continue to work at tourism and geology applications and at further developing GIS and imagery with databases and with industry partners to link artificial intelligence to data to allow the capacity to identify and solve impediments to development of a resource and to best inform investors in the mining industry of the real risks of mining projects to give them greater confidence in projects. Geological undertaken in this period include the updating of clay resources for brick manufacture, water resources in intake areas of local basins.
In 2018 and 2019 I completed a course to qualify as a webmaster and digital marketer to develop and update websites for local business and aspects of the mining industry and to create a site to deliver geohistory tourism to a global community. To date I continue to develop several websites based on geology, geohistory tourism for communities and education and shopping sites based on exercise, diet, wealth for the pursuit of happiness and all aspects a healthy lifestyle.
PUBLICATION LISTS AND PRODUCTS TO 2018
Publications by the principal and managed outputs from Geoscience products
PUBLICATIONS
BULTITUDE, R.J., CRANFIELD, L.C., HEGARTY, R.A., HALFPENNY, R.W., 1985: season. RGMP progress report. Geological Survey of Queensland Record, 1985/31.
BULTITUDE, R.J., CRANFIELD, L.C., HUTTON, L.J., DONCHAK, P.J.T., SHAW, R.D., & SCHNEIDER, S.E., 1985: Bullock Creek, Lyndbrook, and Mungana 1:100 000 Sheet areas. Geological Survey of Queensland Record, 1985/11.
CRANFIELD, L.C., 1973: Ipswich Basin excursion notes. Third International Gondwana Symposium field trip. Geological Survey of Queensland Record, 1973/30.
CRANFIELD, L.C., 1975: Clarence-Moreton Basin, NSW and Queensland In Economic Geology of Australia and Papua New Guinea, 2, Coal, (editors, Traves, D.N., and King, D., AUSIMM Monograph series, 6, 328-333.
CRANFIELD, L.C., 1977: Heavy mineral sand deposits of southeast Queensland. In Day, R.W., (editor) 1977 Field Conference Lady Elliott Island, Fraser Island, Gayndah, Biggenden, 31-33. Geological Society of Australia (Queensland Division).
CRANFIELD, L.C., 1979: Stratigraphic drilling report – GSQ Maryborough 1. Queensland Government Mining Journal, 80, 118-123.
CRANFIELD, L.C., 1980a: Stratigraphic drilling report – GSQ Ipswich 23. Queensland Government Mining Journal, 81, 366-372.
CRANFIELD, L.C., 1980b: Stratigraphic drilling report – GSQ Maryborough 2. Queensland Government Mining Journal, 81, 594-598.
CRANFIELD, L.C., 1981a: Stratigraphic drilling report – GSQ Ipswich 24 and 25. Queensland Government Mining Journal, 82, 468-477.
CRANFIELD, L.C., 1981b: The Ipswich Coalfield. In Hofmann, G.W., (editor) 1981 Field Conference, Brisbane-Ipswich area, 24-28. Geological Society of Australia (Queensland Division).
CRANFIELD, L.C., 1982: Stratigraphic drilling in the Southern Maryborough Basin 1978-1980. Queensland Government Mining Journal, 83, 15-29.
CRANFIELD, L.C., 1983: Shallow stratigraphic drilling in the Brisbane 1:100 000 Sheet area. Geological Survey of Queensland Record, 1983/40.CRANFIELD, L.C., 1984a: Stratigraphic drilling data -Ipswich, Brisbane and Gympie 1:250 000 Sheet areas 1972 to 1976. Queensland Department of Mines Record, 1984/3
CRANFIELD, L.C., 1984b: Revision of 1:250 000 geological mapping in Queensland – basis, rationale, methods and techniques. Queensland Department of Mines Record, 1984/7
CRANFIELD, L.C., 1984c: A catalogue of Compilation Sheets of the Maryborough 1:250 000 Sheet area at a scale of 1:85 000.
CRANFIELD, L.C., 1986a: A field guide to sediments and fossils of the Ipswich Basin. Geological Society of Australia (Queensland Division).
CRANFIELD, L.C., 1986b: The geology of the South Burnett District; in Willmott, W.F., (editor), 1986 Field Conference South Burnett District. Geological Society of Australia, Queensland Division, Brisbane, 1‑12.
CRANFIELD, L.C., 1989a: New Palaeozoic stratigraphic units in the Maryborough 1:250 000 Sheet area, southeast Queensland Queensland Government Mining Journal, 90, 115-120.
CRANFIELD, L.C., 1989b: New and revised Mesozoic stratigraphic units in the Maryborough 1:250 000 Sheet area southeast Queensland. Queensland Government Mining Journal, 90, 163-174.
CRANFIELD, L.C., 1990a: The Gympie Group, and other Permian strata of the Gympie composite terrane. Pacific Rim Congress 90 proceedings, III, pp 99-108. Australasian Institute of Mining & Metallurgy, Parkville, Victoria, Australia, 3052.
CRANFIELD, L.C., 1990b: GSQ Mossman 1 – Preliminary and detailed logs. Department of Resource Industries Record 1990/11.
CRANFIELD, L.C. 1992: Geology of the Lyndbrook 1;100 000 Sheet area. Department of Resource Industries Record 1992/19.
CRANFIELD, L.C., 1993: Stratigraphic units of the Maryborough Basin. Queensland Geology, 5, 18-43.
CRANFIELD, L.C., 1994: Maryborough, Queensland. Sheet SG56-6. 1:250 000 Geological Series – Explanatory Notes, Geological Survey of Queensland, Department of Minerals and Energy
CRANFIELD, L.C., 1996: Geology and Mineralisation of the Gympie Province. In Mesozoic Geology of the eastern Australian Plate. Geological Society of Australia Inc. Abstracts, 43, 156.
CRANFIELD, L.C., 1997: Mining Project Help Wanted. Queensland Government Mining Journal, 98, 1142, 42-43.
CRANFIELD, L.C., 2017: Mapping of Surat Basin coal seam reservoir units. Queensland Minerals and Energy Review. Department of Natural Resources and Mines.
CRANFIELD, L.C., 1999: Gympie Special Sheet 9445, Part 9545, Queensland 1:100 000 Geological Map Commentary. Queensland Department of Natural Resources and Mines, Queensland.
CRANFIELD, L.C., & CROUCH, S.B.S., 1990: Remote sensing as an aid to geological mapping in the Charters Towers area. 5th Australasian Remote Sensing Conference, Perth, Western Australia 8-12th October, 1990.
CRANFIELD, L.C., & DIPROSE, G., 2008: Diamonds, diamond indicator minerals and a review of exploration for diamonds in Queensland. Queensland Geological Record, 2008/4.
CRANFIELD, L.C., & DIPROSE, G., 2008: Macro and microdiamonds Diamond Indicator Minerals and Indicators for Diamond Exploration in Queensland PACRIM Congress 2008. pp 147-152. Australian Institute of Mining and metallurgy
CRANFIELD, L.C., & GARRAD, P.D., 1991: Mines and prospects in the Maryborough 1:250 000 Sheet area. Department of Resource Industries Record 1991/3.
CRANFIELD, L.C., & GREEN, P.M., 1983: Compilation of formation intersections in departmental coal exploration bores (NS series) in the Ipswich Coalfield. Geological Survey of Queensland Record, 1983/12.
CRANFIELD, L.C. & GREEN, P.M., 1983b: Annotated references on the geology of the Ipswich 1:100 000 Sheet area. Geological Survey of Queensland Record, 1983/65.
CRANFIELD, L.C. & HEGARTY, R.A., 1989: Geology of the Rumula 1:100 000 Sheet area. (7964) northeast Queensland. Queensland Department of Mines Record, 1989/20.
CRANFIELD, L.C., & MURPHY, P.R., 1983: type sections of the Bryden formation and Neara Volcanics, Esk Trough, southeast Queensland. Geological Survey of Queensland Record, 1983/68.
CRANFIELD, L.C., & MURRAY, C.G., 1989a: New and revised intrusive units in the Maryborough 1:250 000 Sheet area, Southeast Queensland. Queensland Government Mining Journal, 90, 369-378.
CRANFIELD, L.C., & MURRAY, C.G., 1989b: Geochemistry and tectonic setting of granitic rocks in the Maryborough 1:250 000 Sheet area. Queensland Government Mining Journal, 90, 408-415.
CRANFIELD, L.C., & MURRAY, C.G., 1989c: Geochemistry of basaltic rocks from the Gayndah region in the Maryborough 1:250 000 Sheet area. Queensland Government Mining Journal, 90, 469-480.
CRANFIELD, L.C., & MURRAY, C.G., 1992: Maryborough 1:250 000. SHEET SG 56-6, FIRST EDITION 1992. Department of Resource Industries, Queensland.
CRANFIELD, L.C., & PASCOE, G., 1996: A seamless digital geological GIS for the Moreton region. Program and abstracts of Moreton Bay and Catchment Conference, 43, 156.
CRANFIELD, L.C., & PASCOE, G., 1998: Development of a digital geological GIS for the Moreton region. In: Tibbets, I.R., Hall, N.J., & Denison, W.C., editors, Moreton Bay and Catchment. School of Marine Science, The University of Queensland, Brisbane.pp. 107-110.
CRANFIELD, L.C., & SANDERCOE, C.S., 1988: Geological and botanical features of the Sunshine Coast and Hinterland. 7th International Palynological Congress Brisbane Excursion Guide SB1.
CRANFIELD, L.C., & SCHWARZBOCK, H., 1972: Nomenclature of some Mesozoic rocks in the Brisbane and Ipswich areas, Queensland. Queensland Government Mining Journal, 74, 414-416.
CRANFIELD, L.C., & SCHWARZBOCK, H., 1973: 1st edition Ipswich 1:250 000 geological series, Sheet SG 56-14. Geological Survey of Queensland.
CRANFIELD, L.C., & SCHWARZBOCK, H., 1974a: 1st edition Brisbane 1:250 000 geological series, Sheet SG 56-15. Geological Survey of Queensland.
CRANFIELD, L.C., & SCHWARZBOCK, H., 1974b: New and revised stratigraphic names in the Ipswich 1:250 000 Sheet area. Queensland Government Mining Journal, 75, 322-323.
CRANFIELD, L.C., & SCHWARZBOCK, H., 1976a: The Esk Trough. In Leslie, R.B., and Evans, H.J., (editors) Economic Geology of Australia and Papua New Guinea. AUSIMM Monograph 7, 420-423.
CRANFIELD, L.C., & SCHWARZBOCK, H., 1976b: The Moreton Basin. In Leslie, R.B., and Evans, H.J., (editors) Economic Geology of Australia and Papua New Guinea. AUSIMM Monograph 7, 450-451.
CRANFIELD, L.C., & SCHWARZBOCK, H., 1976c: The Nambour Basin In Leslie, R.B., and Evans, H.J., (editors) Economic Geology of Australia and Papua New Guinea. AUSIMM Monograph 7, 451-452.
CRANFIELD, L.C., & SCOTT, M., 1993: Geology of the Gympie 1:100 000 Special area (9445, 9545) Queensland Geological Record, 1993/20.
CRANFIELD, L.C., & STEPHENS, C., 1986: Excursion guide to the Booubyjan-Ban Ban-Gayndah area. 1986 Field Conference Geological Society of Australia (Queensland Division), 39-41.
CRANFIELD, L.C., CARMICHAEL, D.C., & WELLS, A.T., 1990: Origin and significance for regional correlation of early Jurassic ironstone oolite in the Bundamba Group. Fossil Fuels – Clarence-Moreton basin workshop, June 1990. Bureau of Mineral Resources Record, 1990/22.
CRANFIELD, L.C., CARMICHAEL, D.C., & WELLS, A.T., 1994: Ferruginous oolite and associated lithofacies from the Clarence-Moreton and related basins in southeast Queensland. In Wells, A.T., and O’Brien, P.E., (editors) Geology and petroleum potential of the Clarence-Moreton Basin, New South Wales and Queensland. Australian Geological Survey Organisation, Department of Primary Industries and Energy, Bulletin 241, 144-163.
CRANFIELD, L.C., DENARO, T.J., BURROWS, P.E, BULTITUDE, R.J., PURDY, D.J., DONCHAK, P.J.T., HORTON, D.J., & TANG, E.H.J., in preparation: Mines, mineral occurrences, exploration and geology of the Warwick and Tweed Heads 1:250 000 Sheet areas, Queensland.
CRANFIELD, L.C, DONCHAK, P.J.T., RANDALL, R.E., CROSBY, G.C., & OSBORNE, J., 1998: Geological investigations in the Yarraman Sub Province, Southeast Queensland – Preliminary results of 1997 field work in the Southeast Queensland Project. Queensland Government Mining Journal, 99, 1160, 11-22
CRANFIELD, L. C., DONCHAK, P.J.T., RANDALL, R.E., & CROSBY, G.C., 2001: Geology and Mineralisation of the Yarraman Subprovince, South-east Queensland. Queensland Geology 10, Queensland Department of Natural Resources and Mines.
CRANFIELD, L.C., GREEN, P.M., HUTTON, L.J., & GRIMES, K.G.,1986: Brisbane 1:100 000 Geological map – Sheet 9543, first Edition. Queensland Department of Mines.
CRANFIELD, L.C., HUTTON, L.J., & GREEN, P.M., 1981: Ipswich 1:100 000 Geological map – Sheet 9543, first Edition. Queensland Department of Mines.
CRANFIELD, L.C., HUTTON, L.J., & GREEN, P.M., 1989: Ipswich 1:100 000 Geological map commentary. Queensland Department of Resource Industries.
CRANFIELD L.C., McELROY, C.T., and SWARBRICK, C.F.J., 1975: The Clarence Moreton Basin. In Traves, D.M. and King, D., (editor). Economic Geology of Australia and Papua New Guinea. Coal. Australian Institute of Mining and Metallurgy Monograph, 6, 328 -333.
CRANFIELD, L.C., SCHWARZBOCK, H., & DAY, R.W., 1976: Geology of the Ipswich and Brisbane 1:250 000 Sheet areas. Geological Survey of Queensland Report, 95.
CRANFIELD, L.C., SCOTT, M., PASCOE, G.C., & LANE, R.P., 1999: Gympie 1:100 000 Special Geological map (Gympie & Laguna Bay). Department of Natural Resources and Mines, Brisbane.
CRANFIELD, L.C., SHORTEN, G., SCOTT, M., & BARKER, R., 1997: Geology and mineralisation of the Gympie Province. In Ashley, P.M., and Flood, P.G., (editors) Tectonics and Metallogenesis of the New England Orogen: Geological Society of Australia Special publication 19, 128 –147.
CRANFIELD, L.C., STEPHENS, C. & BRUVEL, F., 1996: Field Guide to Mesozoic Plate Metallogenesis and magmatism-in south east Queensland. Mesozoic Geology of the eastern Australian Plate. Mesozoic ‘96 Conference. Geological Society of Australia, Qld Division.
CRANFIELD, L.C., TUTTLE, J.S., PASCOE, G., & GREIG, J., 1997: Paper one day, GIS the next. Converting paper and digital records into the South –east Queensland Geological GIS. In Beeston, J., (compiler). Proceedings of the Queensland Development 1997 Conference, 13-14 November, Brisbane, Department of Natural Resources and Mines, 109 –116.
CRANFIELD, L.C., TUTTLE, J.S., PASCOE, G., 1998: Paper one day, GIS the next. Converting paper and digital records into the South –east Queensland Geological GIS. Proceedings of the 14 th AGC Geological Society of Australia Queensland Division
CRANFIELD, L.C., WARNER, K.R., & DONCHAK, P.J.T., 1980: Moreton bay Islands water supply – geological Reconnaissance. Geological Survey of Queensland Record, 1980/38.
DASH, P.H., & CRANFIELD, L.C., 1993: Mineral occurrences – Rumula 1:100 000 Sheet area, north Queensland. Queensland Geological Record 1993/17. Department of Minerals and Energy.
DAY, R.W., CRANFIELD, L.C., & SCHWARZBOCK, H., 1974: Stratigraphy and structural setting of Mesozoic basins in southeast Queensland and northeastern New South Wales. The Tasman Geosyncline – a symposium. Geological Society of Australia (Queensland Division).
HILL, P.G., & CRANFIELD, L.C., 1992: Offshore Maryborough Basin, extent, structure, and petroleum potential from new geophysical survey. in Cenozoic and Mesozoic basins of offshore Australia. Abstracts from the AAPG International Conference, Sydney 1992. American Association of Petroleum Geologists Bulletin, 76, 7, 1107-1108.
KASTANIS, L.E., & CRANFIELD, L.C., 1992: use of remotely sensed data to identify and map rubber vine (Cryptostegia Grandiflora) in northern Australia. 6th Australasian Remote Sensing Conference. 2-6th November 1992 Wellington New Zealand. 1, 410-412.
MURPHY, P.R., SCHWARZBOCK, H., CRANFIELD, L.C., WITHNALL, I.W., & MURRAY, C.G., 1976: Geology of the Gympie 1:250 000 Sheet area. Geological Survey of Queensland Report, 96.
MURPHY, P.R., TREZISE, D.L., HUTTON, L.J., & CRANFIELD, L.C., 1974: Caboolture 1:100 000 Geological map. Geological Survey of Queensland.
MURPHY, P.R., TREZISE, D.L., HUTTON, L.J., & CRANFIELD, L.C., 1987: Caboolture 1:100 000 Geological map Commentary. Geological Survey of Queensland.
MURRAY, C.G., & CRANFIELD, L.C., 1989: Geology of the Rockhampton Region. In Whitaker, W.G, (editor), Field Conference Rockhampton Region. Geological Society of Australia (Queensland Division).
SCOTT M., & CRANFIELD, L.C., 1993: Geological mapping in the Gympie 1:100 000 Sheet area – an update for 1991-1992. Queensland Government Mining Journal 94, 22-30.
SCOTT, M., CRANFIELD, L.C., ROBERTSON, A.D.C., & MURRAY,C.G., 1990: Base and precious metals in the Gympie Composite Terrane. PACRIM CONGRESS 90, 217-229. Australasian Institute of Mining and Metallurgy.
SCOTT, M., CRANFIELD, L.C., MURRAY, C.G., BARKER, R.M., BURROWS, P.E., DONCHAK, P.J.T., 1991: Geological mapping and metallogenic studies in the Gympie 1:100 000 Sheet area. Queensland Government Mining Journal, 92, 401-408.
WELLS, A.T., O’BRIEN, P.E., WILLIS, I.L., & CRANFIELD, L.C., 1990: A new lithostratigraphic framework for the Early Jurassic units in the Bundamba Group, Queensland and New South Wales. Bureau of Mineral Resources Geology and Geophysics Australia, 11, 397-404.
MANAGED OUTPUTS – SOUTHERN REGION GROUP 1995-2002
DONCHAK, P.J.T., LITTLE, T.A., SLIWA, R., & HOLCOMBE, R.J., 1995: Geology of metamorphic units of the North D’Aguilar Block -Goomeri, Nanango and Nambour 1:100 000 sheet areas. Queensland Geological Record, 1995/7.
CROUCH, S.B.S., DONCHAK, P.J.T., TENISON WOODS, K., SCOTT, M., KWIECIEN, W. & GRAYSON, R., 1995: Plutonic rocks of the North D’Aguilar Block. Queensland Geological Record, 1995/8.
RANDALL, R.E., OSBORNE, J.H., DONCHAK, P.J.T., CROSBY, G.C. & SCOTT M., 1996: A Review of Mineral Exploration and known Mineral Occurrences within the Goomeri (9345), Nambour (9444) and Nanango (9344) 1:100 000 Sheet Areas, South Queensland. Queensland Geological Record, 1996/4.
CRANFIELD, L.C., 1996: Geology and Mineralisation of the Gympie Province. In Mesozoic Geology of the eastern Australian Plate. Geological Society of Australia Abstracts , 43, 156.
CRANFIELD, L.C., 1997: Mining Project Help Wanted. Queensland Government Mining Journal, 98 (1142), 42-43.
CRANFIELD, L.C., & PASCOE, G., 1996: A seamless digital geological GIS for the Moreton region. Program and abstracts of Moreton Bay and Catchment Conference, 43, 156.
CRANFIELD, L.C., & PASCOE, G., 1998: Development of a digital geological GIS for the Moreton region. In:Tibbets, I.R., Hall, N.J., & Denison, W.C., editors, Moreton Bay and Catchment. School of Marine Science, The University of Queensland, Brisbane.pp. 107-110.
CRANFIELD, L.C, DONCHAK, P.J.T., RANDALL, R.E., CROSBY, G.C., & OSBORNE, J., 1998: Geological investigations in the Yarraman Sub Province, Southeast Queensland – Preliminary results of 1997 field work in the Southeast Queensland Project. Queensland Government Mining Journal, 99, 1160,11-22
CRANFIELD, L. C., DONCHAK, P.J.T., RANDALL, R.E., & CROSBY, G.C., 2001: Geology and Mineralisation of the Yarraman Subprovince, South-east Queensland. Queensland Geology 10, Queensland Department of Natural Resources and Mines.
CRANFIELD, L.C., SCOTT, M., PASCOE, G.C., & LANE, R.P., 1999: Gympie 1:100 000 Special Geological map (Gympie & Laguna Bay ). Department of Natural Resources and Mines, Brisbane.
CRANFIELD, L.C., SHORTEN, G., SCOTT, M., & BARKER, R., 1997: Geology and mineralisation of the Gympie Province. In Ashley, P.M., and Flood, P.G., (editors) Tectonics and Metallogenesis of the New England Orogen: Geological Society of Australia Special Publication, 19, 128 –147.
CRANFIELD, L.C., STEPHENS, C., & BRUVEL, F., 1996: Field guide to Mesozoic plate metallogenesis. Geological Society of Australia Queensland Division, November, 1996.
CRANFIELD, L.C., TUTTLE, J., PASCOE, G., & GREIG, J., 1997: Paper one day, GIS the next. Converting paper and digital records into the South –east Queensland Geological GIS. In Beeston, J., (compiler). Proceedings of the Queensland Development 1997 Conference, 13-14 November, Brisbane, Department of Natural Resources and Mines, 109 –116.
CRANFIELD, L.C., TUTTLE, J., & PASCOE, G., 1998: Paper one day, GIS the next. Converting paper and digital records into the South –east Queensland Geological GIS. Proceedings of the 14 th AGC Geological Society of Australia Queensland Division.
CROUCH, S.B.S., TANG, J. & KWIECIEN, W., 1997: Geochemistry of the plutonic rocks of the North D’Aguilar Block. Queensland Government Mining Journal, 98, 1144, 6 -18.
CHAMBERLIN, R.M., 1997: Geological maps, structural data, assay data and petrographic descriptions for railroad cuttings in the Triassic North Arm Volcanics, Eumundi Deviation – North Coast Railway, Southeastern Queensland. Queensland Geological Record, 1997/7.
WILLEY, E.C. 1998: Maronghi Creek Beds: A Preliminary appraisal. QueenslandGovernment Mining Journal, 99,1161, 49-56.
O’SULLIVAN, P.B., KOHN, B.P., & CRANFIELD, L.C., 1999: Fission track constraints on the Mesozoic thermotectonic history of the northern New England Orogen, southeastern Queensland. Regional geology, tectonics and metallogenesis. New England Orogen. NEO ’99 conference proceedings, pp285-293. Earth Sciences, University of New England, Armidale NSW 2351, Australia.
CRANFIELD, L.C., 1999: Gympie Special Sheet 9445, Part 9545, Queensland 1:100 000 Geological Map Commentary. Queensland Department of Natural Resources and Mines, Queensland.
CRANFIELD, L.C., RANDALL, R.E., & PASCOE, G.C., 1999: Kingaroy 1:100 000 Geological Map. Department of Mines & Energy, Brisbane.
SOUTHERN REGION GEOSCIENCE, 1999: Geoscience investigations in south Queensland, 1997 and 1998 – A new 1:100 000 geological map and publication release. Queensland Government Mining Journal, 100 (1174), 26-27.
RANDALL, R.E., DONCHAK, P.J.T., CROUCH, S.B.S., & PASCOE, G.S., 1999: Nanango 1:100 000 Geological map sheet. Department of Natural Resources and Mines.
DONCHAK, P.J.T., CROUCH, S.B.S., & PASCOE, G.C., 1999: Goomeri 1:100 000 Geological Map. Department of Mines & Energy , Brisbane.
TANG, J.E.H., & GUST, D.A., 2000: Revision and petrogenetic significance of intrusive units in the North D’Aguilar Block, south-east Queensland. Queensland Government Mining and Energy Journal, 101(1184), 49-61.
HORTON, D.J., 2000. New western Queensland opal field maps. Queensland Government Mining Journal, 101 (1182), 42-45.
CRANFIELD, L.C., TUTTLE, J.T., & PASCOE, G., 2000: South-east Queensland Geoscience Information Package. Department of Natural Resources and Mines. (Arcview version November 2000)
TUTTLE, J.T., CRANFIELD, L.C., & PASCOE, G., 2001: South-east Queensland Geoscience Information Package. Department of Natural Resources and Mines. (Map Info version version February 2001)
CRANFIELD, L.C, DONCHAK, P.J.T., RANDALL, R.E., & CROSBY, G.C., 2001: Geology and mineralisation of the Yarraman Subprovince South-east Queensland. Queensland Geology, 10.
CRANFIELD, L.C. CROSBY, G.C., & PASCOE, G.C., 2001: Esk 1:100 000 Geological Map. Department of Natural Resources & Mines, Brisbane.
CRANFIELD, L.C., DENARO, T.J., BURROWS, P.E, BULTITUDE, R.J., PURDY, D.J., DONCHAK, P.J.T., HORTON, D.J., & TANG, E.H.J., in preparation: Mines, mineral occurrences, exploration and geology of the Warwick and Tweed Heads 1:250 000 Sheet areas, Queensland.
CRANFIELD, L.C., GRAYSON, R.G., & TUTTLE, J.S. (compilers) 2006; Slope stability on basalt plateaux in southeast Queensland. (A series of reports on constraints to closer development and an ARCGIS and MAPINFO GSI version. Department of Natural Resources, Mines and Water.
OUTPUTS – MINERAL RESOURCE STUDIES GROUP 2003-2009
BURROWS, P.E., 2004: Mines, mineralisation and mineral exploration in the Rockhampton, Ridgelands and Rookwood 1:100 000 Sheet areas, central Queensland. Queensland Geological Record, 2004/3.
DENARO, T.J., WITHNALL, I.W., CUKPEPER, L.G., M.J., BURROWS, P.E., &. MORWOOD, D.A., 2003: Mines, mineralisation and mineral exploration in the Duchess and Boulia 1:250 000 Sheet areas, north-west Queensland. Queensland Geological Record, 2003/4.
DENARO, T.J., Z. KYRIAZIS, FITZELL, M.J., MORWOOD, D.A., & BURROWS, P.E., 2004: Mines, mineralisation and mineral exploration in the Northern Drummond Basin, Central Queensland. Queensland Geological Record, 2004/6.
DENARO, T.J., CULPEPER, L.G., BURROWS, P.E., & MORWOOD, D.A.,2004. Mines, mineralisation and mineral exploration in the Cloncurry 1:250 000 Sheet area, north-west Queensland. Queensland Geological Record, 2004/1.
GARRAD, P.D., (compiler), 2004: Queensland Minerals Second Edition 2004
GARRAD, P.D., & RAMSDEN, C., (compilers), 2006: Queensland Minerals Third Edition 2006
GARRAD, P.D., & WITHNALL, I.W., 2004: Mineral Occurrences – Saint Lawrence and port Clinton 1:250 000 Sheet areas, Central Queensland, Geological Survey of Queensland Record, 2004/7.
LAM, J.S., 2004: A review of company exploration for metalliferous mineralisation in the Mackay 1:250 000 Sheet area. Queensland Geological Record, 2004/4.
LAM, J.S., & von GNEILINSKI, F.E., 2004: A review of mines and metalliferous mineralisation in the Mackay (special) 1:250 000 Sheet area (including the Bundarra Pluton porphyry copper deposits). Geological Survey of Queensland Record, 2004/5.
LAM, J.S, 2005a: A review of mines and metalliferous mineralisation in the Munduberra 1:250 000 Sheet area, Queensland. Geological Survey of Queensland Record, 2005/1.
LAM, J.S, 2005b: A review of exploration, mines and metalliferous mineralisation in the Clermont 1; 250 000 Map Sheet area Queensland Geological Record, 2005/2.
SCOTT, M., (compiler) 2006: Mineral resource Assessment of the Yarrol province, central Queensland. Department of Natural Resources and Mines Review Series.
CRANFIELD, L.C., GRAYSON, R.G., & TUTTLE, J.S. (compilers) 2006: Slope stability on basalt plateaux in southeast Queensland. (A series of reports on constraints to closer development and ARCGIS and MAPINFO GiS versions. Department of Natural Resources , Mines and Water.
DENARO, T.J., CRANFIELD, L.C., FITZELL, M.J., BURROWS, P.E., & MORWOOD, D.A., 2007: Mines, mineralisation and mineral exploration in the Maryborough 1:250 000 Sheet Area, South-East Queensland Queensland Geological Record, 2007/1
LAM, J.S.F., & Garrad, P.D., 2007: A summary of field inspection of mineral deposits of the Hodgkinson Province. Queensland Geological Record, 2007/2
FELTRIN, LEONARDO, BAKER, TIMOTHY, SCOTT, MARGARETHA, WILKINSON, KATE & BERTELLI MARTINA 2007: Application of worms and euler deconvolution estimates in 3D geomodelling: prospecting for epithermal gold systems in the Drummond and Bowen Basins. 4th international conference ‘GIS in geology & earth sciences.
Lam, J.S.F., & HODGKINSON, J., 2008: Mines, mineralisation and mineral exploration in the Chinchilla 1:250 000 Sheet Area. Queensland Geological Survey of Record, 2008/3
CRANFIELD, L.C., & DIPROSE, G., 2008: Diamonds, diamond indicator minerals and a review of exploration for diamonds in Queensland. Queensland Geological Record, 2008/4.
CRANFIELD, L.C., & DIPROSE, G., 2008: Macro and microdiamonds Diamond Indicator Minerals and Indicators for Diamond Exploration in Queensland PACRIM Congress 2008. pp 147-151. Australian Institute of Mining and metallurgy.
TANG, J., 2008: An integrated Geochemical Approach for Future Mineral Exploration in Queensland. PACRIM Congress 2008. pp 221-224. Australian Institute of Mining and metallurgy.
SCOTT, M., FELTRIN, L., Mc LENNAN, J., WILKINSON, K., DIXON, O., BLAKE, P., & PURDY, D., 2008: Three-Dimensional Numerical Modelling – Tools for Assessing Mineral Resource Potential Under Cover. PACRIM Congress 2008. pp 243-251. Australian Institute of Mining and metallurgy.
FELTRIN, L., BAKER, T., OLIVER, N., WILKINSON, K., FITZELL, M., DIXON, O., & BERTELLI, M., 2008: Using geomodelling and geophysical inversion to evaluate the geological controls on low-sulphidation epithermal Au-Ag mineralisation in the Drummond and Bowen Basins. Proceedings of American Institute of Physics Conference, 1009, pp123-148.
CRANFIELD, L.C., DENARO, T.J., BURROWS, P.E, BULTITUDE, R.J., PURDY, D.J., DONCHAK, P.J.T., HORTON, D.J., & TANG, E.H.J., 2019: Mines, mineral occurrences, exploration and geology of the Warwick and Tweed Heads 1:250 000 Sheet areas, Queensland. Geological Survey of Queensland and Department of Primary Industries, New South Wales.
MANAGEMENT ACHIEVEMENTS -PAPUA NEW GUINEA- 2009-2013
- Editing of all outputs from GSD 2009-2012 including delivery of the collaborative GEOMAP geology maps, airborne geophysics, geochemistry, GEOMAP digital archive, the Ramu metallogenic map and the Buna 1:250 000 geological map and explanatory notes. The Wabag Special metallogenic map is in final production and requires editing.
- Delivery of GSD staff projects (see appendix for all reports) including a new product PNG Minerals 2011 which documents current status of all mines and prospects by commodity and includes a brief summary of PNG geology. Geological framework and mineralization of Papua New Guinea — an update was produced with Stephen Sheppard and includes current references on PNG geology.
- Negotiated access and delivery of IPSAR radar from DIGO and scanning of Geoscience Australia’s airphotos and notebook data over PNG to develop a country-wide geological database of samples.
- Organised photgraphing and repacking of all samples from the GSPNG core library.
- Managed the creation of new databases for Surface Geology (with former GMME manager ) and mineral occurrences and exploration summaries based on the Geological Survey of Queensland’s and GSWA databases.
- Attended conferences in China, Malaysia, and Toronto and generated material and presentations, and promoted PNG’s exploration and mining industry and the new GSD products.
- Approved and edited research contributions by staff undertaking overseas MSc studies in UK and Germany.
- Submission of MRA Board papers for restructuring on GSD to include coal and geothermal units.
- Member of MAC deliberating on PNG’s mining tenure applications and renewals with guidelines and an assessment template.
- Organised and budgeted for attendance of staff at conferences emphasizing IGC 2012.
- Wrote TORs for World bank projects and for a new airborne survey of western PNG (WAPNGS), assessed tenders for World bank and MRA Board approval.
- Negotiated agreements with China Geological Survey for ongoing collaboration and for training and analysis of samples for a country-wide program geochemistry program.
- Trained staff of Regulatory Operations Division in techniques of assessing reporting by exploration companies in Papua New Guinea in 2013.
- Assessed tenders for a digital tenement management system in PNG in 2013
- Assessed statistics for mining production for PNGs Sovereign Wealth Fund Infrastructure project.
- Assessed Mining Lease applications for OK Tedi extension and Woodlark Island and Mining Advisory Council in 2013.
OUTPUTS GEOLOGICAL SURVEY DIVISION, PNG, 2009-2012
BANDELOW, F., 2012: 1:100 000 Geological map series of Papua New Guinea, Sheet 7987 Musak. Port Moresby: Mineral Resources Authority.
DAVIES, H.A., and WILLIAMSON, A.N., 2012: 1:250, 000 Geological map series of Papua New Guinea, Sheet 7787 Buna. Port Moresby: Mineral Resources Authority.
DOBMEIER, C. J., 2012: 1:100 000 Geological map series of Papua New Guinea, Sheet 7787 Jimi. Port Moresby: Mineral Resources Authority.
DOBMEIER, C. J. and PAPUA, S., 2012: 1:100 000 Geological map series of Papua New Guinea, Sheet 7788 Rain. Port Moresby: Mineral Resources Authority.
DOBMEIER, C. J. and POKE, B., 2012: 1:100 000 Geological map series of Papua New Guinea, Sheet 7887 Aiome. Port Moresby: Mineral Resources Authority.
DOBMEIER, C. J., POKE, B. and WAGNER, B., 2012: 1:100 000 Geological map series of Papua New Guinea, Sheet 7886 Minj. Port Moresby: Mineral Resources Authority.
EGARA, S. S., 2010: Groundwater study for Minj Town- Jivaka Province. Geological Survey Technical Note TN 06/2010.
EGARA, S.S., 2011: Martyrs Memorial High School groundwater study report. Technical Note TN 06/2010.
EGARA, S., VERAVE, R. and LAHAN, M. 2010: Report on radiometric survey of suspected uranium Occurrences on Sudest Island. Geological Survey Technical Note, TN 08/ 2010.
GEOMAP ARCHIVE 2012: All technical reports and database and maps from the Geomap Project 2006-2011.
IRARUE, P., AND R. VERAVE, 2010. Seismic refraction survey for geotechnical investigations at the relocation of the RVO office, Kokopo. Technical Note TN 2/2010.
IRARUE , P., KAWAGLE, S.A., and MOSUSU, N.T., 2012. Using derivatives to interpret airborne magnetic data on the Ramu 1:250 000 sheet area. Science in New Guinea Journal, 31 (2011),pp33-48.
IRARUE, P., SWALILI, D., EGARA, S., and MOSUSU, N., 2010. Resistivity survey for groundwater investigations, Simberi Island, New Ireland Province, Geological Survey Technical Note TN./2010.
IRARUE, P., KUNA G. and SWALILI, D., 2012: 01/2012, Kudjip Seismic refraction survey, , Geological Survey technical note 01/2012.
KUMAN, N., 2011: Grace Memorial groundwater investigation, Geological Survey Technical Note, TN 04/2011.
KUNA, G.,2011, Site inspection report on LMP and SME Surrender – OK Tedi Mining, Geological Survey technical note, TN 06/2011.
KUNA, G., 2011: Geotechnical appraisal of Gulf – Southern highlands Highway route, Desk study Report submitted to Dept of Transport.
KAWAGLE, S and VERAVE, R., 2010. Recent marine investigation of the Ontong Java Plateau, South Western Pacific, Geological Survey Technical Note TN 04/2010.
MOSUSU, N., in preparation. Geophysical signatures of crustal lineament control on regional magmatism and mineralization, Double and Porgera, Papua New Guinea. Geological Survey Technical Note.
MOSUSU. N, 2011; Resistivity survey for ground water development at Finschafen, Morobe, Geological Survey technical note TN 09/2011.
MOSUSU, N. and GIWI, L,2011: Magnetic signature of the Kusi mineralised prospect, Garaina, Morobe Province Geological Survey technical note TN 05/2011.
MOSUSU, N and SWALILI, D.2011. Chimbu limestone geophysical investigation, Chuave, Chimbu Province Geological Survey technical note TN 01/2011.
MOSUSU, N, EGARA, S. and SWALILI, D., 2010: Direct current resistivity surveyfor groundwater investigations, Minj Town, Jiwaka Province, Geological Survey Technical Note Geological Survey Technical Note TN 05/2010.
MOSUSU, N., EGARA, S., KUNA, G., IRARUE, P AND VERAVE, R., 2009. Kairiru Island geothermal reconnaissance survey, East Sepik Province. Geological Survey Report Geological Survey Technical Note, TN 3/2010.
MOSUSU, N., IRARUE, P, & SWALILI, D., 2010. Resistivity Survey for groundwater, Simberi Island, New Ireland Province. Geological Survey Technical Note TN 08/2010
MOSUSU, N.T., 2012. Magnetic signature of the Kusi mineral prospect, Papua New Guinea. Journal of Earth Science and Engineering, 2 (2012), pp209-219.
MOSUSU, N, IRARUE, P and VERAVE, R, 2012, Magnetic signature of the Kotna mineral prospect, Hagen, Western Highlands Province: Mineral Resources Authority, Papua New Guinea, Technical Note 2012/02, 18p.
NIRU, P., 2012: Urban geology map and report for Port Moresby. Mineral Resources Authority 2012.
SAROA D, TSIPERAU CU, ABIARI, I, BOKIUK AL, KUMAN, N, LAHAN , MM, POKE,B, TEVLONE AP and SHEPPARD, S, 2012: A preliminary re-examination of the geology of the Wau–Bulolo area: Mineral Resources Authority, Papua New Guinea, Technical Note 2012/2.
SAROA, D , VERAVE, R , AND LAHAN. M.,2011: Resistivity survey of a salt deposit and geothermal areas in Wau – Bulolo. Geological Survey technical note 03/2011.
SAROA, D., 2012: PNG Minerals 2011. Mineral Resources Authority 2012.
SHEPPARD, S. AND CRANFIELD, L.C., 2012: Geological framework and mineralization of Papua New Guinea — an update. Mineral Resources Authority 2012.
SPIELER, O. & HOEFLAKEN VAN, F., 2012: 1:100 000 Geological map series of Papua New Guinea, Sheet 7488 Double. Port Moresby: Mineral Resources Authority.
SPIELER, O. S., 2012: 1:100 000 Geological map series of Papua New Guinea, Sheet 7686 Wapenamanda. Port Moresby: Mineral Resources Authority.
TIMM, F., 2012: 1:100 000 Geological map series of Papua New Guinea, Sheet 7986 Bundi. Port Moresby: Mineral Resources Authority.
TIMM, F., 2012: 1:100 000 Geological map series of Papua New Guinea, Sheet 7785 Ialibu. Port Moresby: Mineral Resources Authority.
TIMM, F. & MUKE, L., 2012: 1:100 000 Geological map series of Papua New Guinea, Sheet 7885 Kubor. Port Moresby: Mineral Resources Authority.
TIMM, F., 2011: Geology of Kubor Anticline, PNG. Geological Survey technical note 07/2011.
VERAVE, R., EGARA, S., IRARUE, P. and MOSUSU, N., 2009. Groundwater investigation at Martyrs’ Secondary School, Oro Province. Geological Survey Technical Note TN 10/2009.
VERAVE, R, LAHAN, M. AND IRARUE, P., 2010. Seismic refraction survey for geotechnical investigations at the new DMPGM Headquarters, Konedobu. . Geological Survey Technical Note TN 10/2009.
VERAVE, R., LAHAN, M., AND EGARA, S., 2011. , Geophysical Investigation of suspected uranium radiation health risk on Sudest Island Milne Bay Province using a gamma ray spectrometer, Geological Survey technical note 02/2011
WAGNER, B. & SPIELER, O., 2012: 1:100 000 Geological map series of Papua New Guinea, Sheet 7786 Hagen. Port Moresby: Mineral Resources Authority.
MANAGEMENT AND OVERSEAS WORK EXPERIENCE
Light burning shale project for Austral Bricks January 2018
Technical Director Coal Seam Gas project Surat Basin, Queensland, September 2015- march 2017
International Geological Expert, National Geological Survey Project 2016
Consultant assessor and trainer, Regulatory Operations Division, Mineral resources Authority, PNG 2013
Executive manager Geological Survey Division, Mineral Resources Authority, PNG 2009-2012
Geoscience Manager Mineral Resource Studies 2003-2009
Lecturing in API/GIS, Hong Kong University, February-July 2003
Team Leader Project Facilitation 2001-2002
Southern Regional Geoscience Manager 1995-2001, 2003
Voluntary English teaching Zhejiang University City College, Hangzhou, China 2002
Acting as Director, Geological Survey of Queensland December 1999, March-April, 2000; March 2003, December 2003, January 2004, January 2005, February, March, April, July August, September 2005, May, July-August 2006)
AREAS OF EXPERIENCE
I was employed with the Department of Minerals & Energy since1969; major projects include assessment of coal resources, geological mapping, stratigraphic drilling, water resources, interpretation and management of satellite and geophysical imagery and development of Project GIS. Leadership of projects has been a part of my work since 1970.
Coal Resource Assessment – -Ipswich Coalfield 1969-1970
Geological mapping
1:250 000 Scale
-Ipswich/Brisbane 1970-1973
– Gympie 1973-1976
– Maryborough 1979-1994
Yarraman Sub Province 2001
Warwick-Tweed Heads 2001-2002
1:100 000 Scale
– Caboolture 1974-1976
– Ipswich 1978-1981
– Brisbane 1981-1982
– Lyndbrook 1982-1986
– Rumula 1984-1986
– Clarence Moreton Basin 1988
– Charters Towers 1990
– Gympie 1990-1993
– Murwillumbah, Nambour 1996
– Mount Lindesay 1996
Southeast Queensland maps 1996-1998
-Yarraman Sub province 1996-1998
Mineral Occurrence Mapping
– Maryborough 1:250 000 1991-1992
– Kingaroy 1997
– Boondooma 1998
Yarraman Sub Province 2000-2001
Warwick – Tweed Heads 2001-2003
Maryborough 1:250 000update 2005
Diamonds in Queensland 2007-2008
Management of program 2003-2009
Water resources – Moreton Bay Islands 1977
Stratigraphic drilling -Ipswich 1:250 000 1972-1974
– Gympie 1:250 000 1973-1975
— Nambour 1:100 000 1977
– Brisbane 1:100 000 1978
– Ipswich 1:100 000 1978-1979
– Maryborough 1:250 00 1979 – 1982
– Rumula 1:100 000 1990
Satellite image interpretation
-Ipswich 1:100 00 (MSS data) 1978
– Charters Towers 1:100 000 1990
-Lyndbrook 1:100 000 1986
– Gympie 1:100 000 1991-1992
– Hann River, Walsh
and Red River,1:250000 1993
– Nanango/Goomeri/Nambour, 1:100 000
1993-1994
– Ridgelands/
Rockhampton 1:100 000 1993-1994
– Lolworth 1:100 000 1994
-SEQ 2001 area 1995 -1999
-Yarraman Sub Province 1996-1999
Warwick Texas area 2000-2001
Mount Rawdon Project area 2008-2009
Forensic Geology
Gave evidence on the results of analysis of sand samples from a body in the murder of Yvonne Mary Laenen 1978
Environmental issues
Site geology of a Proposed radioactive materials store, Redbank 1989
Site geology of the Mount Taylor Gold Mines (Kingston) 1989
Soils mapping City of the Gold Coast 2000
GIS on constraints to closer development on basalt areas of SE Qld 2004
Geophysical and satellite image data management and interpretation
This includes the generation of catalogues for all hard copy and digital imagery held by the Geological Survey, business case for purchase of computer hardware and software, evaluation of tenders for AIRDATA project and computer equipment, justification of purchases 1993 –1995
Yarraman Sub Province 1996-1999
Texas Subprovince 2000-2001
Mount Rawdon Corridor project 2008-2009
Geoscience GIS products
Southeast Queensland GIS 1998
Southeast Queensland GIS version 2 (including Warwick-Tweed Heads) 2002
Courses and training
Modern and ancient volcanic successions 1985
Report writing course – 1986
4 wheel driving course 1986
EGRU remote sensing workshop JCU Townsville 1987
AMIRA technology transfer workshop 1988
Interpretation of Geophysical imagery 1988
First aid courses 1989 onwards-annual updates
Leadership development course – Internal 1989
AMIRA technology transfer workshop 1989
Middle Management course – Kooralbin 1990
AMIRA technology transfer workshop 1990
Spectral properties of Geological Materials and Vegetation, Perth 1990
BRS search and command directory 1990
Effective presentation skills 1990
Sedimentology course 1990
Advanced GIS course UNSW 1993
Plan perfect training 1992
Microsoft Word, Excel, and Powerpoint training 1994,1995
UNIX training at Computer vision 1995
UNIX training at Griffith university 1995
ER Mapper training 1995
Intrepid training 1995
Change management workshop 1996
ArcView training 1996
Map Info training 1996
Aspects of strategic planning for mineral exploration 1997
Quantitive estimation of undiscovered mineral deposits 1997
Ore textures interpretation 1997
Landsat TM imagery interpretation 1997
Introduction to Windows NT 1997
Project management workshop 1997
Ergonomics and office handling 1998
Workforce management strategies for the Queensland Public Service 1998
Introduction to accrual accounting 1998
Learning curve aeromagnetics 1998
SAP training for managers 1998
SAP entering cash flows 1998
MFO output performance measures 1998
MFO state budget process 1998
Resuscitation refresher course 1999
MFO analysis and interpretation of financial reports 1999
MFO developing and managing an output budget 1999
Ethical Skills training 1999
Exploration in ore deposits 2000
Negotiation and influencing skills workshop 2000
Arc/GIS training 2005
ER Mapper training 2006
Mentoring training skills 2006
MS Access training 2006
ARC GIS update 2010


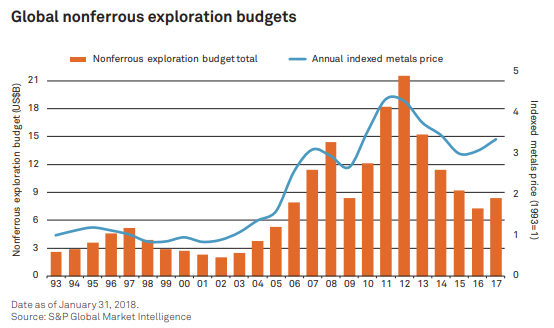
 major miners (revenues >US$1 billion) allocated only a small proportion of revenues to exploration with riskier exploration remaining relatively unattractive.